

Is the construction industry in recovery or transition?
That’s the question raised by Rider Levett Bucknall’s North America Quarterly Construction Cost report for the second quarter of 2021.
On the positive side, the major economic indicators showed no signs for concern. Inflation in the first quarter of 2021 rose 1.7% over the previous quarter. The Gross Domestic Project increased by 6.4% in the first quarter of 2021 compared to the same period a year ago. And the index for Architectural Billings, at 55.6 in March, was above the 50 mark for the first time since Q4 2019. (It rose again in April, to 57.9.)
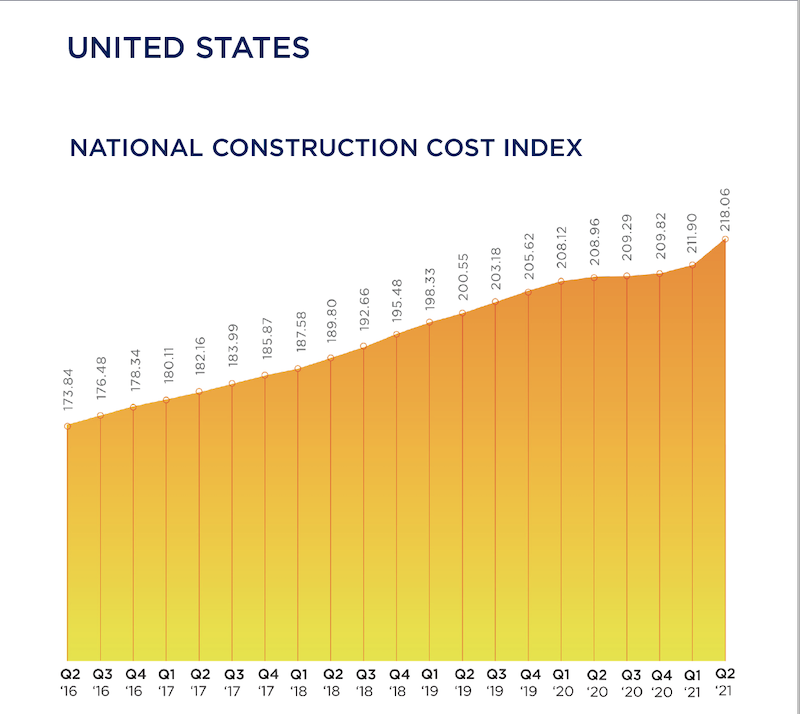
RLB’s Construction Cost Index, at 218.06 for the first quarter of 2021, was 4.6% above the same quarter in 2020. And construction in place in April, as valued by the U.S. Commerce Department, stood at $1.524 trillion, 9.8% higher than in April 2020.
On the glass-half-empty side, the construction industry is still hampered by supply-chain bottlenecks, volatile commodity prices, delayed permitting processes and materials tariffs. The ongoing shortage of qualified labor—construction unemployment, while down in the first quarter, was still 8.6%—is also having an impact on projects’ cost and scheduling, making budgeting and bidding “highly uncertain,” says RLB’s report.
The immediate future isn’t all that clear, either, what with the possibility of climbing interest rates, and the Biden Administration’s prioritizing clean energy and reduced carbon levels in response to climate change, which might also affect construction prices.
SEVERAL METROS EXCEED NATIONAL COST GROWTH AVERAGES
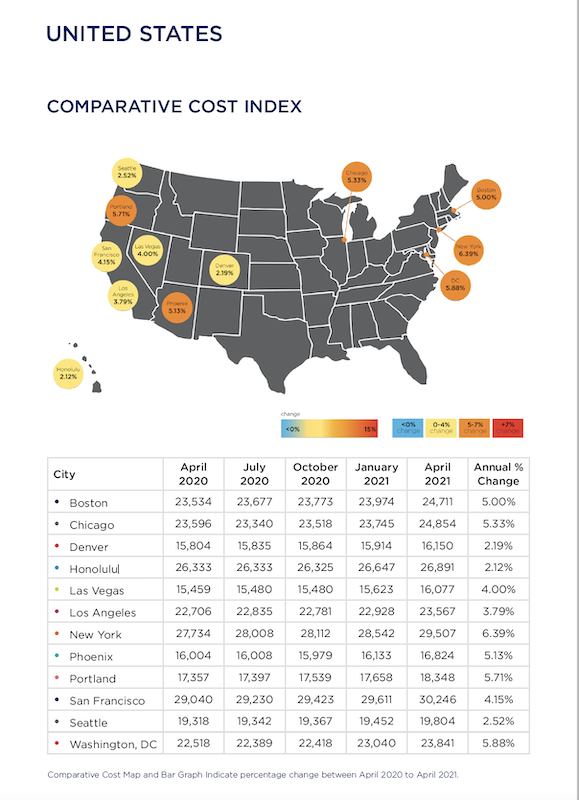
Construction spending was on the rise in all the metros that RLB tracked, several at rates higher than the 4.35% national average for the first quarter.
A closer look at construction costs per square foot found that San Francisco or Honolulu led the pack for hotels, industrial buildings, parking, five-star hotels, residential housing, and elementary education. New York outpaced other cities for new retail, high schools, and universities.
Boston, Chicago, New York, Phoenix, Portland, and Washington, D.C. all experienced percentage increases in construction costs above the 4.35% quarterly national average during Q1 2021 versus the same quarter a year ago. Other locations below the national average included Denver, Honolulu, Los Angeles, San Francisco, and Seattle. Las Vegas experienced the same escalation as the national average.
RLB thinks the most critical choices that GCs and CMs now face is identifying which building sectors to target while operating in a business environment that’s been altered by the coronavirus pandemic. For example, in the first quarter, the industrial sector grew by 12%, year-over-year; conversely hotels and hospitality projects contracted by 9%.
“One of the lessons learned from the past year is the central—and growing—role that technology plays in the AEC industries,” wrote Julian Anderson, FRICS, President of Rider Levett Bucknall North America. “The degree of operational efficiency that connected technologies affords is a true game changer, providing transparency, accuracy, and consistency to all stakeholders while accelerating the design process. From cost estimating to streamlining workflows to digital twins, these tools are transforming the landscape of design and construction.”
Related Stories

Construction Costs | Apr 18, 2024
New download: BD+C's April 2024 Market Intelligence Report
Building Design+Construction's monthly Market Intelligence Report offers a snapshot of the health of the U.S. building construction industry, including the commercial, multifamily, institutional, and industrial building sectors. This report tracks the latest metrics related to construction spending, demand for design services, contractor backlogs, and material price trends.

Market Data | Apr 16, 2024
The average U.S. contractor has 8.2 months worth of construction work in the pipeline, as of March 2024
Associated Builders and Contractors reported today that its Construction Backlog Indicator increased to 8.2 months in March from 8.1 months in February, according to an ABC member survey conducted March 20 to April 3. The reading is down 0.5 months from March 2023.

K-12 Schools | Apr 10, 2024
Surprise, surprise: Students excel in modernized K-12 school buildings
Too many of the nation’s school districts are having to make it work with less-than-ideal educational facilities. But at what cost to student performance and staff satisfaction?
Multifamily Housing | Apr 9, 2024
March reports record gains in multifamily rent growth in 20 months
Asking rents for multifamily units increased $8 during the month to $1,721; year-over-year growth grew 30 basis points to 0.9 percent—a normal seasonal growth pattern according to Yardi Matrix.

Retail Centers | Apr 4, 2024
Retail design trends: Consumers are looking for wellness in where they shop
Consumers are making lifestyle choices with wellness in mind, which ignites in them a feeling of purpose and a sense of motivation. That’s the conclusion that the architecture and design firm MG2 draws from a survey of 1,182 U.S. adult consumers the firm conducted last December about retail design and what consumers want in healthier shopping experiences.

Market Data | Apr 1, 2024
Nonresidential construction spending dips 1.0% in February, reaches $1.179 trillion
National nonresidential construction spending declined 1.0% in February, according to an Associated Builders and Contractors analysis of data published today by the U.S. Census Bureau. On a seasonally adjusted annualized basis, nonresidential spending totaled $1.179 trillion.

Market Data | Mar 26, 2024
Architecture firm billings see modest easing in February
Architecture firm billings continued to decline in February, with an AIA/Deltek Architecture Billings Index (ABI) score of 49.5 for the month. However, February’s score marks the most modest easing in billings since July 2023 and suggests that the recent slowdown may be receding.

K-12 Schools | Mar 18, 2024
New study shows connections between K-12 school modernizations, improved test scores, graduation rates
Conducted by Drexel University in conjunction with Perkins Eastman, the research study reveals K-12 school modernizations significantly impact key educational indicators, including test scores, graduation rates, and enrollment over time.
MFPRO+ News | Mar 16, 2024
Multifamily rents stable heading into spring 2024
National asking multifamily rents posted their first increase in over seven months in February. The average U.S. asking rent rose $1 to $1,713 in February 2024, up 0.6% year-over-year.

Market Data | Mar 14, 2024
Download BD+C's March 2024 Market Intelligence Report
U.S. construction spending on buildings-related work rose 1.4% in January, but project teams continue to face headwinds related to inflation, interest rates, and supply chain issues, according to Building Design+Construction's March 2024 Market Intelligence Report (free PDF download).


