

Through April of this year, the national average increase in construction cost was 4.48%, annualized. Construction put in place during April 2019, at a seasonally adjusted annualized rate of $1.299 trillion, was 1.2% below construction put in place in April 2018.
In its just-released second quarter Construction Cost Report for North America, which is based on data from a dozen U.S. markets ansdn two Canadian markets, the construction management consultant Rider Levett Bucknall reiterates the financial and time impacts that the shortage of qualified trade workers is having on the construction industry’s productivity and expansion.
“Even as technology transforms the jobsite, improving both efficiency and worker safety, skilled-labor recruitment and retention are essential to the future of construction,” writes Julian Anderson, FRICS, Rider Levett Bucknall’s President-North America. “As worker shortage makes projects more costly and slower to build, the risk of undermining broader economic growth increases.”
RLB’s National Construction Cost Index stood at 200.55 in the second quarter of 2019, up from 189.8 in the same quarter a year earlier, and 182.16 in Q2 2017. Keep in mind that these increases are occurring at a time when there has been relatively little inflation in the economy.
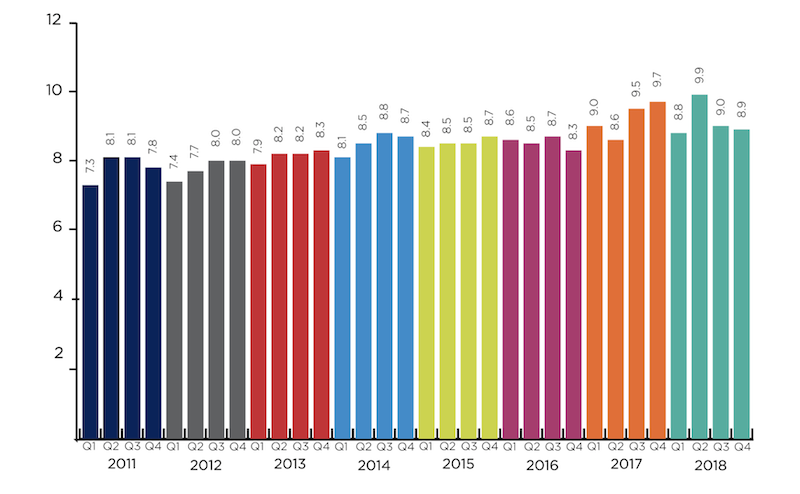
The construction backlog in North America was more than nine months in the second quarter. Image: Rider Levett Bucknall, from Associated Builders and Contractors estimates.
RLB's estimates are in line Turner Construction's quarterly Building Cost Index (https://bit.ly/2xWrf61), which the GC giant released on July 16. That Index, at 1149, was up 1.23% over the first quarter, and 5.51% over the second quarter of 2018. “Contractors continue to be selective due to the availability of skilled labor,” wrote Attilio Rivetti, Turner's vice president responsible for compiling its cost index.
To further make its case, RLB cites the Associated Builders and Contractors’ Construction Backlog Indicator, which reflects the amount of work that will be performed by commercial and industrial contractors in the months ahead. The backlog for 2018 averaged 9.15 months, slightly below the 2017 average but still up 17% from 2011.
The report breaks down current building costs by market and by seven typologies: offices, retail, hotels, hospitals, warehouses, parking, and residential. For example, Las Vegas, Phoenix, Portland, Seattle, and Denver continue to be relative bargains for office construction, based on their costs per sf. Los Angeles, Washington DC, and New York are the high-priced spreads when building hospitals. As for hotel construction, Honolulu and San Francisco are priciest.
Overall, Chicago experienced the greatest increase in construction bid costs (including materials, labor, and fees), 8.77%, between April 2018 and April 2019, followed San Francisco (7.05%), Portland (6.82%), Seattle (6.68%), Phoenix (6.47%), and Honolulu (5.83%), all above the national average increase.
Los Angeles, while no slouch on the construction front, was the only metro that RLB tracks that experienced a decrease in construction costs in the second quarter, down 1.22%.
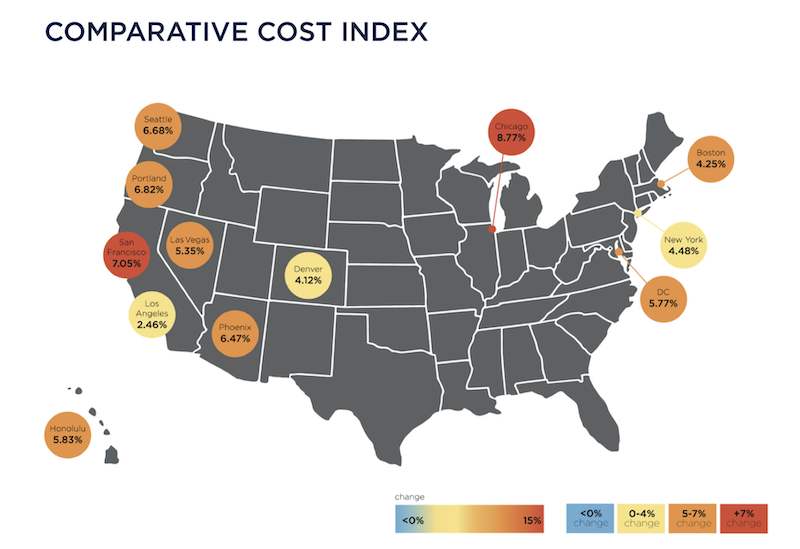
Chicago experienced the highest percentage increase in quarterly construction costs. Image: Rider Levett Bucknall
Through the first quarter of 2019, construction unemployment remained steady at 5.2%. The vast majority of construction firms are still having trouble filling open positions. And this situation could worsen, according to the Associated General Contractors of America, as a result of the Trump Administration’s proposal, announced last month, which would exclude the construction sector from the Labor Department’s apprenticeship framework. (Currently, more than three quarters of the federally administered apprenticeships in the U.S. are either in construction or part of military training, notes RLB.)
In a separate report that gauges construction activity by the number of cranes in use in North America, RLB’s July survey marked the fourth consecutive increase. However, only two of 11 U.S. markets tracked—Los Angeles and Denver—saw an increase in cranes. Five other cities were steady.
Cranes for commercial projects were up nationally and accounted for 41% of the cranes in use in New York City. In all markets, mixed-use and multifamily residential construction accounted for 67% of the cranes counted. In Seattle alone, mixed use and residential required 78% of cranes used.
Related Stories

Hotel Facilities | Apr 24, 2024
The U.S. hotel construction market sees record highs in the first quarter of 2024
As seen in the Q1 2024 U.S. Hotel Construction Pipeline Trend Report from Lodging Econometrics (LE), at the end of the first quarter, there are 6,065 projects with 702,990 rooms in the pipeline. This new all-time high represents a 9% year-over-year (YOY) increase in projects and a 7% YOY increase in rooms compared to last year.

Construction Costs | Apr 18, 2024
New download: BD+C's April 2024 Market Intelligence Report
Building Design+Construction's monthly Market Intelligence Report offers a snapshot of the health of the U.S. building construction industry, including the commercial, multifamily, institutional, and industrial building sectors. This report tracks the latest metrics related to construction spending, demand for design services, contractor backlogs, and material price trends.

Market Data | Apr 16, 2024
The average U.S. contractor has 8.2 months worth of construction work in the pipeline, as of March 2024
Associated Builders and Contractors reported today that its Construction Backlog Indicator increased to 8.2 months in March from 8.1 months in February, according to an ABC member survey conducted March 20 to April 3. The reading is down 0.5 months from March 2023.

K-12 Schools | Apr 10, 2024
Surprise, surprise: Students excel in modernized K-12 school buildings
Too many of the nation’s school districts are having to make it work with less-than-ideal educational facilities. But at what cost to student performance and staff satisfaction?
Multifamily Housing | Apr 9, 2024
March reports record gains in multifamily rent growth in 20 months
Asking rents for multifamily units increased $8 during the month to $1,721; year-over-year growth grew 30 basis points to 0.9 percent—a normal seasonal growth pattern according to Yardi Matrix.

Retail Centers | Apr 4, 2024
Retail design trends: Consumers are looking for wellness in where they shop
Consumers are making lifestyle choices with wellness in mind, which ignites in them a feeling of purpose and a sense of motivation. That’s the conclusion that the architecture and design firm MG2 draws from a survey of 1,182 U.S. adult consumers the firm conducted last December about retail design and what consumers want in healthier shopping experiences.

Market Data | Apr 1, 2024
Nonresidential construction spending dips 1.0% in February, reaches $1.179 trillion
National nonresidential construction spending declined 1.0% in February, according to an Associated Builders and Contractors analysis of data published today by the U.S. Census Bureau. On a seasonally adjusted annualized basis, nonresidential spending totaled $1.179 trillion.

Market Data | Mar 26, 2024
Architecture firm billings see modest easing in February
Architecture firm billings continued to decline in February, with an AIA/Deltek Architecture Billings Index (ABI) score of 49.5 for the month. However, February’s score marks the most modest easing in billings since July 2023 and suggests that the recent slowdown may be receding.

K-12 Schools | Mar 18, 2024
New study shows connections between K-12 school modernizations, improved test scores, graduation rates
Conducted by Drexel University in conjunction with Perkins Eastman, the research study reveals K-12 school modernizations significantly impact key educational indicators, including test scores, graduation rates, and enrollment over time.
MFPRO+ News | Mar 16, 2024
Multifamily rents stable heading into spring 2024
National asking multifamily rents posted their first increase in over seven months in February. The average U.S. asking rent rose $1 to $1,713 in February 2024, up 0.6% year-over-year.


