
")
In my last post, I began to explore an emerging phenomena at public universities: the growth in out-of-state and international enrollment as a percentage of the total student population, in part to help meet budget shortfalls. This post examines where those students appear to be coming from, and how demographic changes in the college-aged U.S. population could impact this trend.
To get a sense of where the college-aged population is located today, I looked at 2010 Census data and isolated the 18-year-old population as the hypothetical pool of students who could become the “freshman class” in any given year. While the 18-year old population is not a perfect representation of the actual college-going population [i], using this data allows us to compare the population change in this subgroup over time.
By projecting the population in each age cohort (ages 0 through 19) from the 2010 Census data, we can construct an approximate annual population of U.S. 18-year olds in each year from 2009-2028.
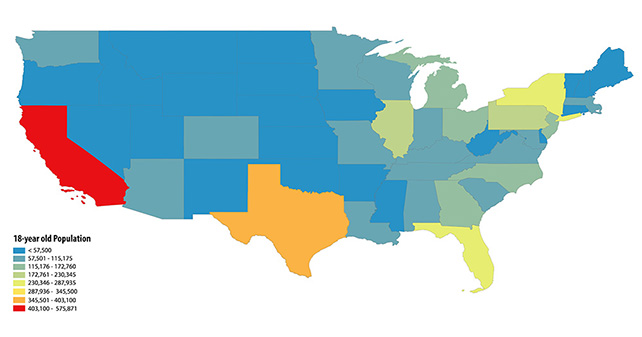 18-year old population by state (2009) Charts: SmithGroup JJR
This map shows the geographical distribution of the 18-year old population by state in 2009, setting up a baseline for understanding the demographic change in the data. California, Texas, Florida, and New York have the largest populations of this group, as may be expected since they are some of the most populous states. The states with the smallest 18-year old population are Wyoming, North Dakota, and Vermont, each with fewer than 10,000.
In addition to understanding where the largest populations of potential students are today, we can also examine how prospective college students move between states to attend school. The National Center for Higher Education Management Systems (NCHEMS) tracks the migration of first-time freshmen across states.
NCHEMS has created an import/export ratio that shows which states are net importers or exporters of college students. They do this by dividing the total number of first-time freshmen from a given state who attend college in other states by the number of first-time out-of-state freshman who are attending college in that state.
States with a ratio less than one are net exporters of students, while those with a ratio greater than one are net importers. Looking at a snapshot from the most recent data available from NCHEMS (2006), we can see which states are net importers and exporters of college students.
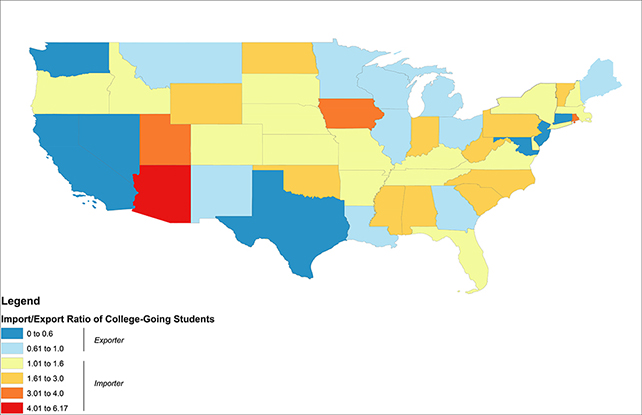 Import/export ratio of college students by state (2006)
Several states with the largest 18-year old populations (CA, TX) are exporters, while others (NY, FL) are importers. All of the states with the lowest 18-year old populations (WY, ND, VT) are strong importers of college students (1.61 to 3.0 ratio). Arizona is the strongest importer of any state, with a ratio of 6.17.
While these import and export ratios may be changing in response to some of the financial pressures on institutions of higher education, there is likely to be an added impact from demographic change in the coming years. Rather than seeking students beyond their state boundaries just to enhance potential tuition revenues, universities in states with declining student-age populations may need to begin importing students just to fill their seats.
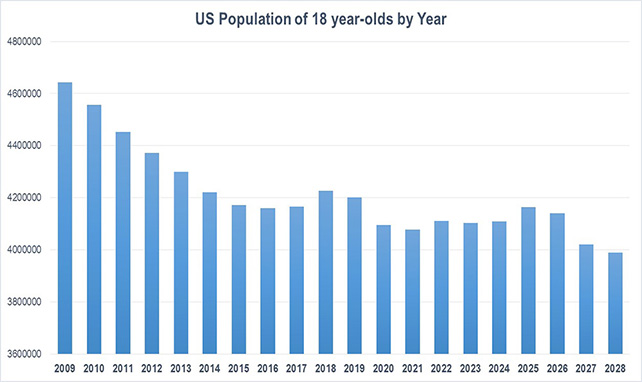 Total U.S. population of 18-year olds by year - 2010 Census projection
The two decades following 2009 will see a pronounced decline (-14%) in the number of 18-year olds based on 2010 Census data. From 2009-2014, the 18-year old population has seen a steep drop. This decline should level off with small spikes of growth in 2018-19 and 2025-26, but the overall population will remain down from its 2009 peak through 2028.
This decline in the U.S. youth population is due to a number of factors and could have major implications for universities across the country. There will be more competition for students, and a potential need to expand the geographic area from which universities have traditionally recruited their students.
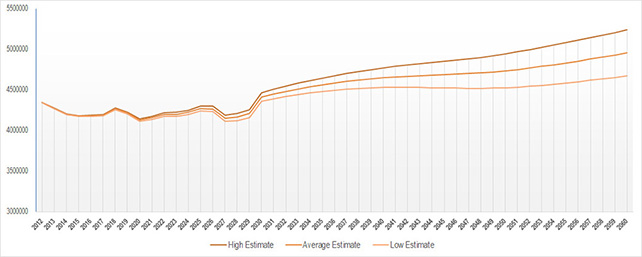 Census projections of 18-year old population (2012-2060)
This situation isn’t likely to improve immediately following 2028 either. Census projections for the 18-year old population do not show growth until after 2030, beyond the point about which we have current data about the birthrate. This lower level of youth population compared with the first decade of the 2000s will be the new baseline for the next couple of decades.
This demographic change will not occur equally across the states, however. While the majority of states will see some decline in their youth populations, in several states the decline is projected to be quite precipitous.
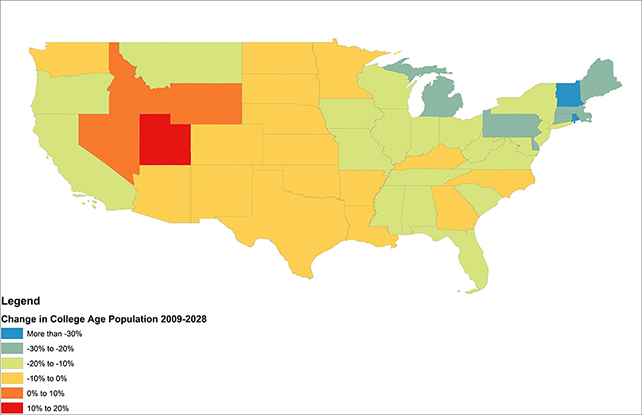 Change in 18-year old population (2009-2028)
Rhode Island, Vermont and New Hampshire will see the greatest declines over this timeframe, with their population of 18-year olds shrinking by over 30%, more than double the national rate (14%). Most states in the east, and California and Oregon on the west coast, will see average declines, while many states in the Southwest and Plains will have slighter lower than average declines (0-10%). Only four will see growth. Utah will lead this group with the strongest growth in its 18-year old population (17%).
The next several decades are likely to create a much more competitive demographic environment for attracting out-of-state students. Out-of-state recruitment seems likely to grow as a strategy that more universities need to use to meet their enrollment targets. As these universities move beyond their local markets to find students, they will need to be able to grow their identity or brand to attract students and compete on a national stage.
Recruiting on this scale will require schools to provide a level of quality in their academics, facilities and amenities that are comparable to a larger pool of peers. The ability for a university to differentiate itself in this crowded market will become increasingly important; it could be accomplished by specializing in top programs, developing new niches, or as recent NCAA conference realignment may suggest, getting their brand onto more television screens.
It will be interesting to see how the geography plays out: will students from the Sunbelt desire to stay near home in warmer climates, or decide to brave the winters of the Northeast? Of the states projected to have the largest declines, Rhode Island may be the best positioned for this change, as they have already become heavy importers of out-of-state students in a state with a declining youth population. These universities may provide interesting case studies for adapting to these changes.
Beyond the individual university, the Western Undergraduate Exchange presents another model to assess the ability to attract students across state lines. This type of regional tuition agreement seems to support Arizona’s status as the top importer of students in the country – see Arizona State University’s direct appeal to California students here.
This strategy of regionally discounting tuition mitigates the potential revenue gains of increased out-of-state enrollment, which is at odds with one of the major drivers of out-of-state recruitment today. However, it could become an important factor in filling seats and maintaining enrollments in the future.
Student supply and demand are coming together in ways that will have a significant impact on the recruiting practices and funding priorities of state university systems throughout the U.S. In the final post of this series, I’ll dig more deeply into the supply of seats by looking at the distribution of college enrollment across the states.
[i]: The limitations in using the 18-year old population as a proxy for the college-aged population are several: (1) some students may be 17 or 19 at the time at which they enroll in college; (2) this metric neglects non-traditional age students who may be first time freshmen; (3) projections from the Census cannot account for population shifts due to immigration that occur after 2010.
About the Author: Alexa Bush's unique design background includes a Masters in Landscape Architecture as well as work in film production and the technology sector. She joined SmithGroupJJR after completing a fellowship in urban design where her work incorporated new avenues for web-based community engagement.
More from Author

SmithGroup | Mar 28, 2023
Inclusive design requires relearning how we read space
Pulling from his experience during a campus design workshop, David Johnson, AIA, LEED AP, encourages architects to better understand how to design spaces that are inclusive for everyone.

SmithGroup | Feb 27, 2023
Surfing the Metaversity: The future of online learning?
SmithGroup's tour of the Metaversity gives us insight on bringing together physical and virtual campuses to create a cohesive institution.

SmithGroup | Nov 28, 2022
Data centers are a hot market—don't waste the heat!
SmithGroup's Brian Rener shares a few ways to integrate data centers in mixed-use sites, utilizing waste heat to optimize the energy demands of the buildings.

SmithGroup | Aug 3, 2022
Designing learning environments to support the future of equitable health care
While the shortage of rural health care practitioners was a concern before the COVID-19 pandemic, the public health crisis has highlighted the importance of health equity in the United States and the desperate need for practitioners help meet the needs of patients in vulnerable rural communities.

SmithGroup | Aug 10, 2021
Retail reset: The future of shopping malls
Developers and design partners are coming together to reimagine how malls can create a new generation of mixed-use opportunities.

SmithGroup | May 17, 2021
Future pandemic preparedness at the medical district scale
The current COVID-19 pandemic highlights the concern that we will see more emergency events in the coming years.

SmithGroup | Jan 25, 2021
Amid pandemic, college students value on-campus experience
All the students we interviewed were glad that they returned to campus in one form or another.

SmithGroup | Aug 13, 2020
Renewing the healing role of public parks
While we can’t accurately predict all the ways we will respond to the current COVID-19 pandemic, it should provide a moment of reflection as we see all too clearly the consequences of our exploitation and destruction of nature.

SmithGroup | Jul 21, 2020
How design of senior living communities must change after COVID-19
The cost of maintaining high quality of care and high quality of life for senior living communities has increased up to 73% for senior living communities that remain free of COVID-19 and up to 103% for COVID-19 positive senior living communities.

SmithGroup | Jun 12, 2020
How will museums change after COVID-19
This new environment may herald innovative economic models and change the way we think about museum design.


