

Associated Builders and Contractors reported today that its Construction Backlog Indicator contracted to 8.9 months during the fourth quarter of 2018, down 1.1% from the third quarter and 7.5% compared to a year ago. CBI reached a record high of 9.9 months in the second quarter of 2018 and averaged about 9.1 months throughout all four quarters of last year.
CBI is a forward-looking economic indicator that reflects the amount of work that will be performed by U.S. commercial, institutional, industrial and infrastructure construction contractors in the months ahead.
“Though backlog has dipped slightly in the last quarter of 2018, it remains high by historic standards,” said ABC Chief Economist Anirban Basu. “A number of factors contributed to the decline, including a surge in materials prices in early 2018, which likely hindered project planning and contract negotiations later in the year. Interest rates also rose during much of the year, potentially resulting in some projects being postponed or canceled. It is also likely that the feverish market volatility during the fourth quarter of 2018 caused some investors to hold off until the financial marketplace stabilized, which it recently did.
“That said, backlog in the heavy industrial segment rose slightly compared to the third quarter of 2018,” said Basu. “In fact, with industrial production surging for much of last year and with capacity utilization on the rise, the industrial category achieved its highest level in the history of the series during the final quarter of 2019.
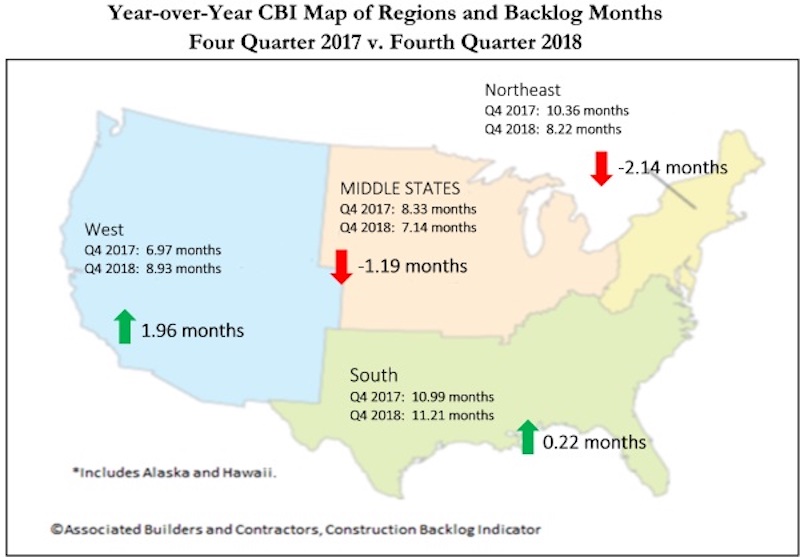
“Backlog in the South expanded at a more rapid pace than in the other three regions during the final quarter of 2018,” said Basu. “This is not altogether surprising—Southern markets like Atlanta; Orlando, Florida; Charlotte, North Carolina; Dallas; and Nashville, Tennessee, are growing significantly. This has much to do with rapid population growth, which naturally creates demand for additional infrastructure. By contrast, the Northeast is hampered by growing concerns regarding overbuilt commercial segments and the Middle States are collectively beginning to feel the effects of an auto production cycle that may have peaked.”
Highlights by Region
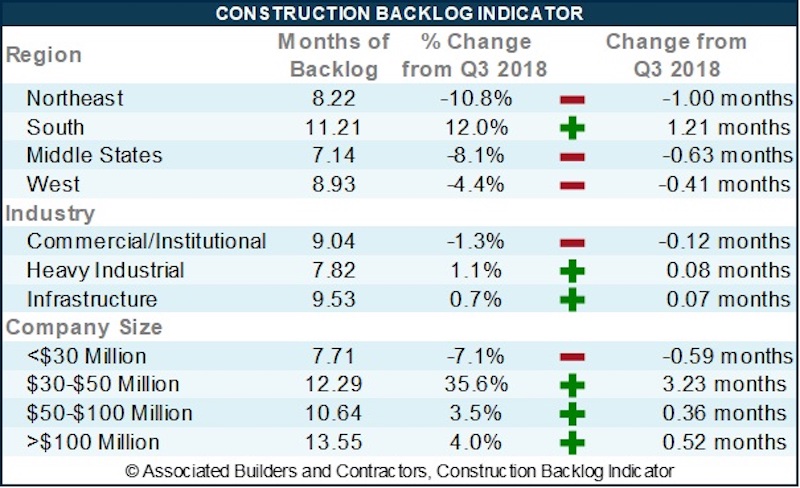
— After decreasing by more than a full month in the third quarter of 2018, backlog in the South bounced back to 11.21 months, the second highest level on record for the region. The South’s backlog remains the highest of the four regions, as has been the case since the fourth quarter of 2014. This is attributable to surging economies in much of the south, including Orlando, Atlanta, Nashville and Dallas.
— Backlog in the Northeast fell by exactly one month from the third quarter of 2018 to the fourth. Backlog is down by more than two months compared to the same time one year ago. There appears to be growing concern that certain segments of commercial real estate are becoming overbuilt, including in the New York, Boston and Washington metropolitan areas. Amazon’s recent HQ2 announcement may help countervail some of these concerns, at least in the Washington metro area.
— Backlog in the Middle States remained between seven and eight months during the entirety of 2018. Still, there has been a gradual pullback in backlog, with the most recent report representing the lowest level of backlog in three years. The Middle States also remain associated with the lowest level of backlog among any region. There is evidence that the auto production and sales cycle has peaked, which has a disproportionate impact on the Middle States.
— Backlog in the West declined on a monthly basis, which could be attributable to the wildfires that ravaged California in November 2018. Regional backlog remains approximately two months higher than during the fourth quarter of 2017 as markets like Phoenix; Los Angeles; San Jose, California; Portland, Oregon; and Seattle continue to experience growth.

Highlights by Industry
— Backlog in the commercial/institutional segment declined by roughly a tenth of a month during the fourth quarter of 2018 and is down 10.2% on a year-over-year basis. Commercial valuations are no longer rising rapidly in much of the nation as capital has become more expensive and global investors appear to have become more defensive. That said, the fourth quarter reading of 9.04 months is well above the industry’s historical average.
— Backlog in the heavy industrial category increased modestly during the fourth quarter of 2018, rising by 0.08 months on a monthly basis. On a yearly basis, the category’s reading increased by an impressive 2.65 months. With capacity utilization rising markedly over the past two years, it is conceivable that backlog in this category will continue to head higher.
— Backlog in the infrastructure category increased by a scant 0.07 months during the fourth quarter and declined significantly during the past year. The lack of faster backlog growth in this category is somewhat surprising, but the combination of ultra-low interest rates and recovering state and local government finances prompted a surge in contracting activity in late 2016 and 2017. In 2018, there was significant growth in infrastructure spending in water, transportation, education and other primarily public-financed categories. Based on the most recent readings, infrastructure spending growth will soften a bit in 2019.

Highlights by Company Size
— Large firms—those with annual revenues in excess of $100 million—experienced gains in backlog totaling more than half a month during 2018’s final quarter. Many of these firms have benefited from large-scale industrial projects planned in Louisiana and other parts of the nation.
— Average backlog among firms with annual revenues between $50 million and $100 million rose by 3.5% during the fourth quarter, unchanged from the same time one year ago. This is consistent with some flattening in commercial/institutional backlog, which serves as a primary source of business for many of these firms.
— Backlog for firms with revenues between $30 million and $50 million has been volatile in recent months, but ended 2018 roughly where it had been at the end of 2015. The current economic expansion has benefited these firms, many of which are specialty trade contractors now in short supply.
— Backlog for firms with annual revenues below $30 million fell to 7.71 months during the fourth quarter, but remains virtually unchanged from the same time a year ago. Backlog among this group has been generally stable over time and there is little to no indication of deterioration.
Related Stories

Construction Costs | Apr 18, 2024
New download: BD+C's April 2024 Market Intelligence Report
Building Design+Construction's monthly Market Intelligence Report offers a snapshot of the health of the U.S. building construction industry, including the commercial, multifamily, institutional, and industrial building sectors. This report tracks the latest metrics related to construction spending, demand for design services, contractor backlogs, and material price trends.

Market Data | Apr 16, 2024
The average U.S. contractor has 8.2 months worth of construction work in the pipeline, as of March 2024
Associated Builders and Contractors reported today that its Construction Backlog Indicator increased to 8.2 months in March from 8.1 months in February, according to an ABC member survey conducted March 20 to April 3. The reading is down 0.5 months from March 2023.

K-12 Schools | Apr 10, 2024
Surprise, surprise: Students excel in modernized K-12 school buildings
Too many of the nation’s school districts are having to make it work with less-than-ideal educational facilities. But at what cost to student performance and staff satisfaction?
Multifamily Housing | Apr 9, 2024
March reports record gains in multifamily rent growth in 20 months
Asking rents for multifamily units increased $8 during the month to $1,721; year-over-year growth grew 30 basis points to 0.9 percent—a normal seasonal growth pattern according to Yardi Matrix.

Retail Centers | Apr 4, 2024
Retail design trends: Consumers are looking for wellness in where they shop
Consumers are making lifestyle choices with wellness in mind, which ignites in them a feeling of purpose and a sense of motivation. That’s the conclusion that the architecture and design firm MG2 draws from a survey of 1,182 U.S. adult consumers the firm conducted last December about retail design and what consumers want in healthier shopping experiences.

Market Data | Apr 1, 2024
Nonresidential construction spending dips 1.0% in February, reaches $1.179 trillion
National nonresidential construction spending declined 1.0% in February, according to an Associated Builders and Contractors analysis of data published today by the U.S. Census Bureau. On a seasonally adjusted annualized basis, nonresidential spending totaled $1.179 trillion.

Market Data | Mar 26, 2024
Architecture firm billings see modest easing in February
Architecture firm billings continued to decline in February, with an AIA/Deltek Architecture Billings Index (ABI) score of 49.5 for the month. However, February’s score marks the most modest easing in billings since July 2023 and suggests that the recent slowdown may be receding.

K-12 Schools | Mar 18, 2024
New study shows connections between K-12 school modernizations, improved test scores, graduation rates
Conducted by Drexel University in conjunction with Perkins Eastman, the research study reveals K-12 school modernizations significantly impact key educational indicators, including test scores, graduation rates, and enrollment over time.

MFPRO+ News | Mar 16, 2024
Multifamily rents stable heading into spring 2024
National asking multifamily rents posted their first increase in over seven months in February. The average U.S. asking rent rose $1 to $1,713 in February 2024, up 0.6% year-over-year.

Market Data | Mar 14, 2024
Download BD+C's March 2024 Market Intelligence Report
U.S. construction spending on buildings-related work rose 1.4% in January, but project teams continue to face headwinds related to inflation, interest rates, and supply chain issues, according to Building Design+Construction's March 2024 Market Intelligence Report (free PDF download).


